
- CPKC transported 690,700 metric tonnes of Canadian grain and grain products in Week 15, the highest Week 15 tonnage on record.
- Overall volume transported is 14 percent higher compared to the previous crop year.
- Week 15 was the 6th consecutive week with more than 600,000 metric tonnes transported on the CPKC Canadian network.
- Unloading and loading rail cars at elevators and terminals consistently and efficiently on a 24/7 basis in all weather conditions is necessary to keep the grain pipeline functioning at high efficiency and capacity.
2026 - 2027 Grain Performance Scorecard
In addition to the information shared with Transport Canada, CPKC voluntarily publishes a weekly supply chain scorecard. The scorecard outlines CPKC's performance for the previous grain week and includes, when necessary, detailed information on any internal or external factors affecting grain movement. The scorecard includes movements of Western Canadian grain and grain products consistent with those required by the minimum mandate legislation of 2013-14, as well as movements of other non-regulated principal field crops.
CPKC’s Grain Performance
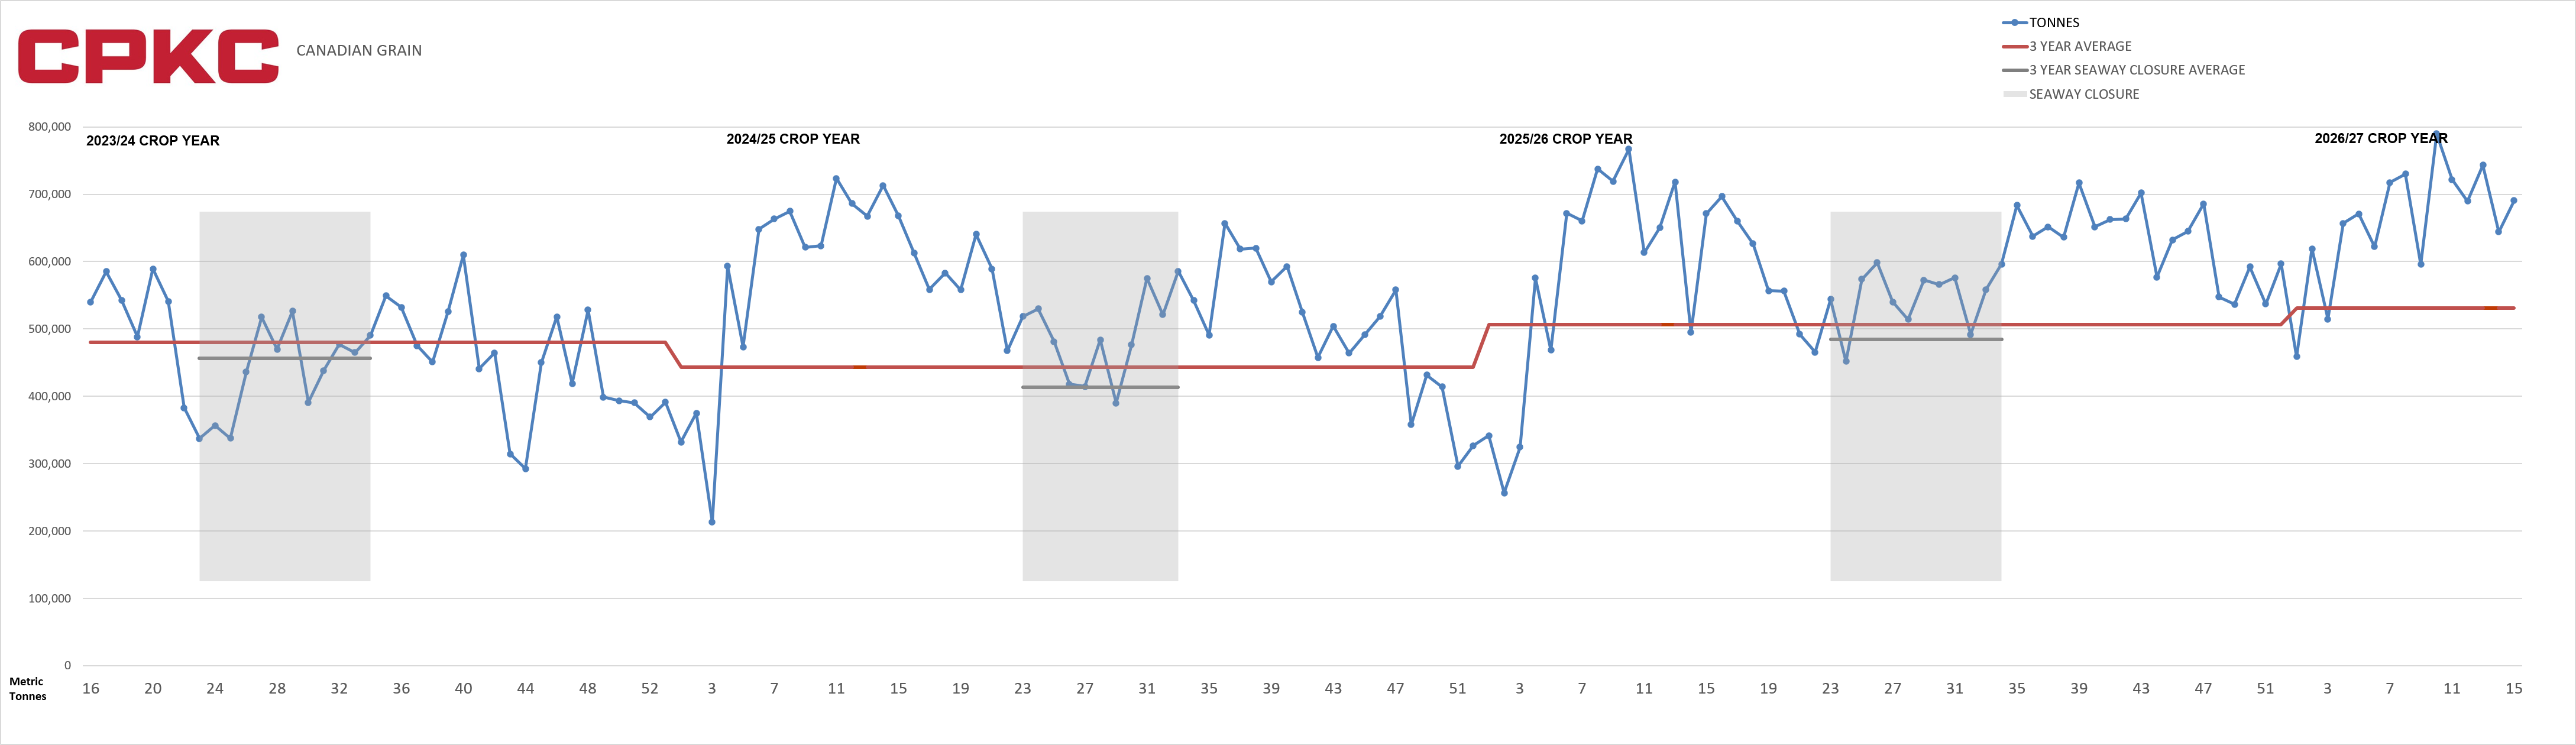
Week 15, November 8, 2026 - November 14, 2026
| Metric Tonnes | Thunder Bay | Vancouver | Eastern Canada | Western Canada | U.S. Destinations | Total |
| Week 15, November 8 - November 14 | 121,715 | 396,644 | 11,227 | 13,523 | 147,591 | 690,700 |
| Metric Tonnes | ||||||
| Thunder Bay | ||||||
| Vancouver | ||||||
| Eastern Canada | ||||||
| Western Canada | ||||||
| U.S. Destinations | ||||||
| Total | ||||||
| Week 15, November 8 - November 14 | ||||||
| 121,715 | ||||||
| 396,644 | ||||||
| 11,227 | ||||||
| 13,523 | ||||||
| 147,591 | ||||||
| 690,700 |
- CPKC transported 690,700 metric tonnes of Canadian grain and grain products in Week 15, the highest Week 15 tonnage on record.
- Overall volume transported is 14 percent higher compared to the previous crop year.
- Week 15 was the 6th consecutive week with more than 600,000 metric tonnes transported on the CPKC Canadian network.
- Unloading and loading rail cars at elevators and terminals consistently and efficiently on a 24/7 basis in all weather conditions is necessary to keep the grain pipeline functioning at high efficiency and capacity.
| Metric Tonnes | Thunder Bay | Vancouver | Eastern Canada | Western Canada | U.S. Destinations | Total |
| Week 15, November 8 - November 14 | 121,715 | 396,644 | 11,227 | 13,523 | 147,591 | 690,700 |
| Metric Tonnes | ||||||
| Thunder Bay | ||||||
| Vancouver | ||||||
| Eastern Canada | ||||||
| Western Canada | ||||||
| U.S. Destinations | ||||||
| Total | ||||||
| Week 15, November 8 - November 14 | ||||||
| 121,715 | ||||||
| 396,644 | ||||||
| 11,227 | ||||||
| 13,523 | ||||||
| 147,591 | ||||||
| 690,700 |
| Metric Tonnes | Thunder Bay | Vancouver | Eastern Canada | Western Canada | U.S. Destinations | Total |
| Week 14, November 1 - November 7 | 101,437 | 380,354 | 16,476 | 12,929 | 132,687 | 643,883 |
| Metric Tonnes | ||||||
| Thunder Bay | ||||||
| Vancouver | ||||||
| Eastern Canada | ||||||
| Western Canada | ||||||
| U.S. Destinations | ||||||
| Total | ||||||
| Week 14, November 1 - November 7 | ||||||
| 101,437 | ||||||
| 380,354 | ||||||
| 16,476 | ||||||
| 12,929 | ||||||
| 132,687 | ||||||
| 643,883 |
- CPKC transported 643,883 metric tonnes of Canadian grain and grain products in Week 14.
- Overall volume transported is 15 percent higher compared to the previous crop year.
- Week 14 was the 5th consecutive week with more than 600,000 metric tonnes transported on the CPKC Canadian network.
- As we head into winter and critical shipping months for Canada’s agricultural industry, it is important for all supply chain participants to work collectively to sustain strong momentum in support of Canada’s reputation as a safe and reliable supplier of grain and grain products.
| Metric Tonnes | Thunder Bay | Vancouver | Eastern Canada | Western Canada | U.S. Destinations | Total |
| Week 13, October 25 - October 31 | 165,951 | 434,869 | 5,863 | 22,388 | 114,275 | 743,346 |
| Metric Tonnes | ||||||
| Thunder Bay | ||||||
| Vancouver | ||||||
| Eastern Canada | ||||||
| Western Canada | ||||||
| U.S. Destinations | ||||||
| Total | ||||||
| Week 13, October 25 - October 31 | ||||||
| 165,951 | ||||||
| 434,869 | ||||||
| 5,863 | ||||||
| 22,388 | ||||||
| 114,275 | ||||||
| 743,346 |
- CPKC transported 743,346 metric tonnes of Canadian grain and grain products in Week 13, the highest Week 13 tonnage on record.
- With Week 13 complete, CPKC set new October monthly records for transporting grain and grain products across Canada.
- Overall volume transported is 14 percent higher compared to the previous crop year.
- To maximize grain supply chain throughput capacity throughout the year, CPKC reminds customers and stakeholders that demand should be balanced and rateable.
| Metric Tonnes | Thunder Bay | Vancouver | Eastern Canada | Western Canada | U.S. Destinations | Total |
| Week 12, October 18 - October 24 | 168,330 | 385,073 | 7,183 | 14,422 | 114,824 | 689,832 |
| Metric Tonnes | ||||||
| Thunder Bay | ||||||
| Vancouver | ||||||
| Eastern Canada | ||||||
| Western Canada | ||||||
| U.S. Destinations | ||||||
| Total | ||||||
| Week 12, October 18 - October 24 | ||||||
| 168,330 | ||||||
| 385,073 | ||||||
| 7,183 | ||||||
| 14,422 | ||||||
| 114,824 | ||||||
| 689,832 |
- CPKC transported 689,832 metric tonnes of Canadian grain and grain products in Week 12, bringing overall volume transported to 15 percent higher than the previous crop year.
- To maximize grain supply chain throughput capacity throughout the year, CPKC reminds customers and stakeholders that demand should be balanced and rateable.
| Metric Tonnes | Thunder Bay | Vancouver | Eastern Canada | Western Canada | U.S. Destinations | Total |
| Week 11, October 11 - October 17 | 152,472 | 427,020 | 9,716 | 14,061 | 118,358 | 721,627 |
| Metric Tonnes | ||||||
| Thunder Bay | ||||||
| Vancouver | ||||||
| Eastern Canada | ||||||
| Western Canada | ||||||
| U.S. Destinations | ||||||
| Total | ||||||
| Week 11, October 11 - October 17 | ||||||
| 152,472 | ||||||
| 427,020 | ||||||
| 9,716 | ||||||
| 14,061 | ||||||
| 118,358 | ||||||
| 721,627 |
- CPKC transported 721,627 metric tonnes of Canadian grain and grain products in Week 11. Overall grain volume transported is 16 percent higher than in the previous crop year.
- For the second straight week, grain volume transported on CPKC’s Canadian rail network exceeded the supply chain target outlined in its 2026-2027 Grain Service Outlook Report.
- As fall harvest nears completion, demand for grain transportation remains strong.
- To maximize grain supply chain throughput capacity throughout the year, CPKC reminds customers and stakeholders that demand should be balanced and rateable.
| Metric Tonnes | Thunder Bay | Vancouver | Eastern Canada | Western Canada | U.S. Destinations | Total |
| Week 10, October 4 - October 10 | 167,768 | 470,040 | 6,917 | 12,320 | 132,677 | 789,722 |
| Metric Tonnes | ||||||
| Thunder Bay | ||||||
| Vancouver | ||||||
| Eastern Canada | ||||||
| Western Canada | ||||||
| U.S. Destinations | ||||||
| Total | ||||||
| Week 10, October 4 - October 10 | ||||||
| 167,768 | ||||||
| 470,040 | ||||||
| 6,917 | ||||||
| 12,320 | ||||||
| 132,677 | ||||||
| 789,722 |
- CPKC transported 789,722 metric tonnes of Canadian grain and grain products in Week 10, the highest Week 10 tonnage on record.
- Week 10 was the highest weekly total of the new crop year, and the highest one-week volume total on record.
- Overall volume transported is 16 percent higher compared to the previous crop year.
- As fall harvest continues, wet weather in Western Alberta has slowed progress and has resulted in slower loading at origin. Demand for grain transportation remains strong.
- To maximize grain supply chain throughput capacity throughout the year, CPKC reminds customers and stakeholders that demand should be balanced and rateable.
| Metric Tonnes | Thunder Bay | Vancouver | Eastern Canada | Western Canada | U.S. Destinations | Total |
| Week 9, September 27 - October 3 | 118,548 | 362,153 | 7,892 | 12,797 | 94,600 | 595,990 |
| Metric Tonnes | ||||||
| Thunder Bay | ||||||
| Vancouver | ||||||
| Eastern Canada | ||||||
| Western Canada | ||||||
| U.S. Destinations | ||||||
| Total | ||||||
| Week 9, September 27 - October 3 | ||||||
| 118,548 | ||||||
| 362,153 | ||||||
| 7,892 | ||||||
| 12,797 | ||||||
| 94,600 | ||||||
| 595,990 |
- CPKC transported 595,990 metric tonnes of Canadian grain and grain products in Week 9.
- With Week 9 complete, CPKC set new September monthly and third quarter records for transporting grain and grain products across Canada and the United States.
- Overall volume transported is 18 percent higher compared to the previous crop year.
- As fall harvest continues, wet weather in Western Canada has slowed progress and has resulted in slower loading at origin. Demand for grain transportation remains strong.
- To maximize grain supply chain throughput capacity throughout the year, CPKC reminds customers and stakeholders that demand should be balanced and rateable.
| Metric Tonnes | Thunder Bay | Vancouver | Eastern Canada | Western Canada | U.S. Destinations | Total |
| Week 8, September 20 - September 26 | 139,556 | 413,398 | 10,894 | 29,224 | 137,034 | 730,106 |
| Metric Tonnes | ||||||
| Thunder Bay | ||||||
| Vancouver | ||||||
| Eastern Canada | ||||||
| Western Canada | ||||||
| U.S. Destinations | ||||||
| Total | ||||||
| Week 8, September 20 - September 26 | ||||||
| 139,556 | ||||||
| 413,398 | ||||||
| 10,894 | ||||||
| 29,224 | ||||||
| 137,034 | ||||||
| 730,106 |
- CPKC transported 730,106 metric tonnes of Canadian grain and grain products in Week 8, the highest Week 8 tonnage on record.
- Week 8 was the highest weekly total of the new crop year, and the highest weekly total since Week 10 of the last crop year in October 2025.
- Overall volume transported is eight percent higher compared to the previous crop year.
- As fall harvest continues, wet weather in Western Canada has slowed progress and has resulted in slower loading at origin. Demand for grain transportation remains strong.
- To maximize grain supply chain throughput capacity throughout the year, CPKC reminds customers and stakeholders that demand should be balanced and rateable.
| Metric Tonnes | Thunder Bay | Vancouver | Eastern Canada | Western Canada | U.S. Destinations | Total |
| Week 7, September 13 - September 19 | 132,109 | 412,925 | 8,211 | 17,921 | 146,305 | 717,471 |
| Metric Tonnes | ||||||
| Thunder Bay | ||||||
| Vancouver | ||||||
| Eastern Canada | ||||||
| Western Canada | ||||||
| U.S. Destinations | ||||||
| Total | ||||||
| Week 7, September 13 - September 19 | ||||||
| 132,109 | ||||||
| 412,925 | ||||||
| 8,211 | ||||||
| 17,921 | ||||||
| 146,305 | ||||||
| 717,471 |
- CPKC transported 717,471 metric tonnes of Canadian grain and grain products in Week 7, the highest Week 7 tonnage on record.
- Week 7 was the highest weekly total of the new crop year, and the highest weekly total since Week 13 of the last crop year in late October 2025.
- Overall volume transported is 29 percent higher compared to the previous crop year.
- As fall harvest continues, wet weather in Western Canada has slowed progress and has resulted in slower loading at origin. Demand for grain transportation remains strong.
- To maximize grain supply chain throughput capacity throughout the year, CPKC reminds customers and stakeholders that demand should be balanced and rateable.
| Metric Tonnes | Thunder Bay | Vancouver | Eastern Canada | Western Canada | U.S. Destinations | Total |
| Week 6, September 6 - September 12 | 160,390 | 338,668 | 10,135 | 26,379 | 86,404 | 621,976 |
| Metric Tonnes | ||||||
| Thunder Bay | ||||||
| Vancouver | ||||||
| Eastern Canada | ||||||
| Western Canada | ||||||
| U.S. Destinations | ||||||
| Total | ||||||
| Week 6, September 6 - September 12 | ||||||
| 160,390 | ||||||
| 338,668 | ||||||
| 10,135 | ||||||
| 26,379 | ||||||
| 86,404 | ||||||
| 621,976 |
- CPKC transported 621,976 metric tonnes of Canadian grain and grain products in Week 6.
- The rolling four-week average is 34 percent higher than the same period last year.
- As fall harvest continues, wet weather in Western Canada has slowed progress and has resulted in slower loading at origin. Demand for grain transportation remains strong.
- To maximize grain supply chain throughput capacity throughout the year, CPKC reminds customers and stakeholders that demand should be balanced and rateable.
| Metric Tonnes | Thunder Bay | Vancouver | Eastern Canada | Western Canada | U.S. Destinations | Total |
| Week 5, August 30 - September 5 | 137,367 | 382,361 | 7,327 | 51,657 | 92,286 | 670,998 |
| Metric Tonnes | ||||||
| Thunder Bay | ||||||
| Vancouver | ||||||
| Eastern Canada | ||||||
| Western Canada | ||||||
| U.S. Destinations | ||||||
| Total | ||||||
| Week 5, August 30 - September 5 | ||||||
| 137,367 | ||||||
| 382,361 | ||||||
| 7,327 | ||||||
| 51,657 | ||||||
| 92,286 | ||||||
| 670,998 |
- CPKC transported 670,998 metric tonnes of Canadian grain and grain products in Week 5, the highest Week 5 tonnage on record. This marks two consecutive weekly records and follows CPKC’s record-setting August grain volumes.
- The rolling four-week average is 49 percent higher than the same period last year.
- While fall harvest is underway, recent weather through Western Canada has slowed progress. Demand for grain transportation remains strong due to the carry out from the 2026/2027 crop year.
- To maximize grain supply chain throughput capacity throughout the year, CPKC reminds customers and stakeholders that demand should be balanced and rateable.
| Metric Tonnes | Thunder Bay | Vancouver | Eastern Canada | Western Canada | U.S. Destinations | Total |
| Week 4, August 23 - August 29 | 95,508 | 438,766 | 5,473 | 12,469 | 104,560 | 656,776 |
| Metric Tonnes | ||||||
| Thunder Bay | ||||||
| Vancouver | ||||||
| Eastern Canada | ||||||
| Western Canada | ||||||
| U.S. Destinations | ||||||
| Total | ||||||
| Week 4, August 23 - August 29 | ||||||
| 95,508 | ||||||
| 438,766 | ||||||
| 5,473 | ||||||
| 12,469 | ||||||
| 104,560 | ||||||
| 656,776 |
- CPKC transported 656,776 metric tonnes of Canadian grain and grain products in Week 4, the highest Week 4 tonnage on record.
- The rolling four-week average is 50 percent higher than the same period last year.
- With the fall harvest underway, demand for grain transportation is expected to ramp up through September. To maximize the grain supply chain’s capacity, demand should be balanced and rateable throughout the crop year.
- CPKC continues working with grain customers to obtain a firm understanding of their specific demand forecasts. Precise and accurate customer forecasts are crucial to CPKC’s resource planning.
| Metric Tonnes | Thunder Bay | Vancouver | Eastern Canada | Western Canada | U.S. Destinations | Total |
| Week 3, August 16 - August 22 | 113,205 | 256,301 | 8,184 | 17,299 | 119,669 | 514,658 |
| Metric Tonnes | ||||||
| Thunder Bay | ||||||
| Vancouver | ||||||
| Eastern Canada | ||||||
| Western Canada | ||||||
| U.S. Destinations | ||||||
| Total | ||||||
| Week 3, August 16 - August 22 | ||||||
| 113,205 | ||||||
| 256,301 | ||||||
| 8,184 | ||||||
| 17,299 | ||||||
| 119,669 | ||||||
| 514,658 |
- CPKC transported 514,658 metric tonnes of Canadian grain and grain products in Week 3.
- The rolling four-week average is 75.2 percent higher than the same period last year.
- Week 3 demand was below CPKC’s available capacity, as outlined in the 2026-2027 Grain Service Outlook Report published on July 31.
- CPKC continues working with grain customers to obtain a firm understanding of their specific demand forecasts. Precise and accurate customer forecasts are crucial to CPKC’s resource planning.
| Metric Tonnes | Thunder Bay | Vancouver | Eastern Canada | Western Canada | U.S. Destinations | Total |
| Week 2, August 9 - August 15 | 158,084 | 335,428 | 7,980 | 28,186 | 89,414 | 619,090 |
| Metric Tonnes | ||||||
| Thunder Bay | ||||||
| Vancouver | ||||||
| Eastern Canada | ||||||
| Western Canada | ||||||
| U.S. Destinations | ||||||
| Total | ||||||
| Week 2, August 9 - August 15 | ||||||
| 158,084 | ||||||
| 335,428 | ||||||
| 7,980 | ||||||
| 28,186 | ||||||
| 89,414 | ||||||
| 619,090 |
- CPKC transported 619,090 metric tonnes of Canadian grain and grain products in Week 2, the highest Week 2 tonnage on record.
- The rolling four-week average is 81.2 percent higher than the same period last year.
- Week 2 demand was below CPKC’s available capacity, as outlined in the 2026-2027 Grain Service Outlook Report published on July 31.
- CPKC continues working with grain customers to obtain a firm understanding of their specific demand forecasts. Precise and accurate customer forecasts are crucial to CPKC’s resource planning.
| Metric Tonnes | Thunder Bay | Vancouver | Eastern Canada | Western Canada | U.S. Destinations | Total |
| Week 1, August 2 - August 8 | 101,771 | 218,576 | 9,740 | 23,622 | 105,184 | 458,893 |
| Metric Tonnes | ||||||
| Thunder Bay | ||||||
| Vancouver | ||||||
| Eastern Canada | ||||||
| Western Canada | ||||||
| U.S. Destinations | ||||||
| Total | ||||||
| Week 1, August 2 - August 8 | ||||||
| 101,771 | ||||||
| 218,576 | ||||||
| 9,740 | ||||||
| 23,622 | ||||||
| 105,184 | ||||||
| 458,893 |
- CPKC transported 458,893 metric tonnes of Canadian grain and grain products in Week 1, the first week of the 2026-2027 Crop Year.
- The rolling four-week average is 58.5 percent higher than the same period last year.
- Week 1 demand was below CPKC’s available capacity, as outlined in the 2026-2027 Grain Service Outlook Report published on July 31.
- Elevators and terminals must unload and load rail cars consistently and efficiently on a 24/7 basis to keep the grain pipeline operating at high efficiency and capacity.